Magnify
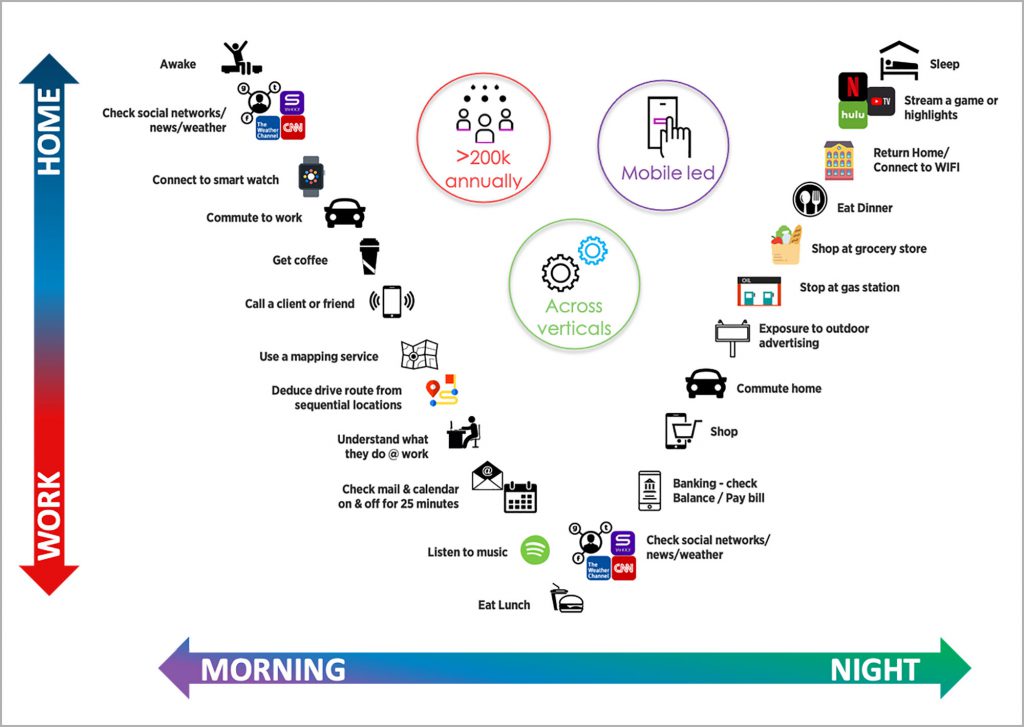
Smartphones connect people to the world – they are a part of everyone’s everyday life. Magnify can provide you with a lens into a day in the life of the consumer. It focuses on smartphone usage to better understand consumer behavior as well as wireless network performance.

A Brief Introduction to Magnify
Magnify is built around an opt-in mobile consumer panel and is able to report on, measure, and evaluate mobile app usage, network performance, and consumer perceptions. Data is collected from consumer Android smartphones 24 hours a day, 7 days a week, whenever and wherever consumers use their devices.
In addition to collecting key usage and performance stats, Magnify can provide consumer sentiment data based on targeted surveys that GWS conducts with consumer panelists. Data can be curated by demographic and/or usage criteria.
Adult panelists are recruited from the top metropolitan areas across the U.S. and U.K. along with consumers located in less populated areas (overall, covering a majority of both populations). Approximately 58 million data points are generated daily by panelists.
Data is anonymously collected and reported in aggregate for market research purposes only.
OMCP – A Powerful Resource
OMCP data can be used to:
- Benchmark product performance vs. competitors
- Assist in product strategy and development
- Identify levers to increase resonance with customers
- Understand partnership opportunities
- Uncover customer perception and attitudes

How it Works
We provide an unprecedented view of the “consumer experience” via a mobile phone user’s daily activities. Here’s how it works:


App Store


The Net Result

Commerce
Consumer usage of key commercial verticals (shopping, food, etc).

Finance
Understanding of how consumers engage with digital financial interests

gaming
Insights on mobile gaming by genre by title, category, segments, etc.

Streaming
In depth view of video streaming across service (Netflix, Hulu, etc.)

Social Media
Tracking key social media and impacts across consumer behavior

Connectivity
Insights into consumer connectivity including coverage and performance by network
Bottom line: Do you want to know how consumers use your product and your competitor’s (and what they think about it)?
Performance
Measure coverage, speed, video and gaming performance across networks that delivery key consumer services

Engagement
Monitor usage statistics and characteristics of services /apps – including volume of users, frequency of use, time spent on services, daily, weekly, monthly etc. by geography

Benchmark
Gain competitive insights on key competitors across performance and usage variables; determine a realistic understanding of market share

Attitudes
Understand user satisfaction, willingness to recommend, reasons for using your service or for switching to your competitor’s service
If you'd like to see a sample of actual data
If you'd like us to contact you to set up a demo


